Dryland crop management supported by COALA products
Dryland crop management supported by COALA products
- June 27, 2021
- Agrisat
- Blog
- No Comments
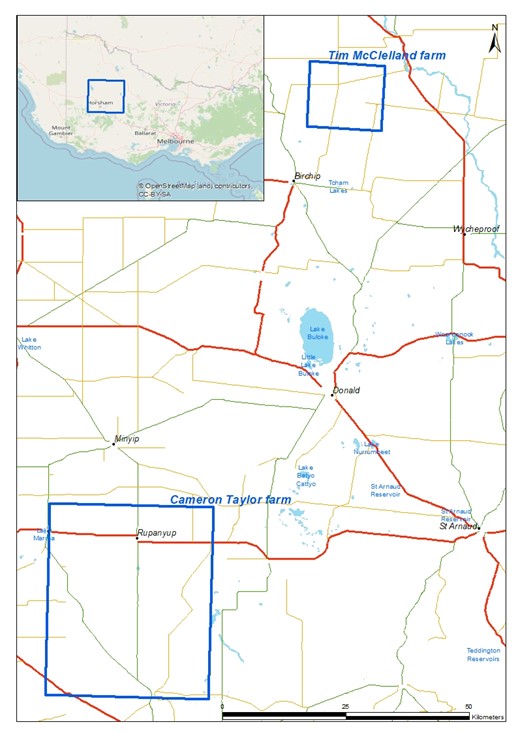
Two of the COALA project partners have been working throughout this past 2020 campaign to assist in managing dryland crops. Now, AgriSat and UCLM have generated satellite-derived COALA products to assist in dryland crop management in the Mallee and Wimmera regions of Victoria, Australia. The products have been generated for farms owned by BCG members. In this blog post, we report on the on-farm experience of two of these growers collaborating on the project. A few weeks ago, you met these farmers in our previous blog post, Tim McClelland and Cameron Taylor. The map below shows the location of these farms.
The COALA products supporting dryland crop management
Four different COALA products have been generated in this campaign (winter 2020):
- Day-to-day crop monitoring using time series of satellite images (see text, video & image below).
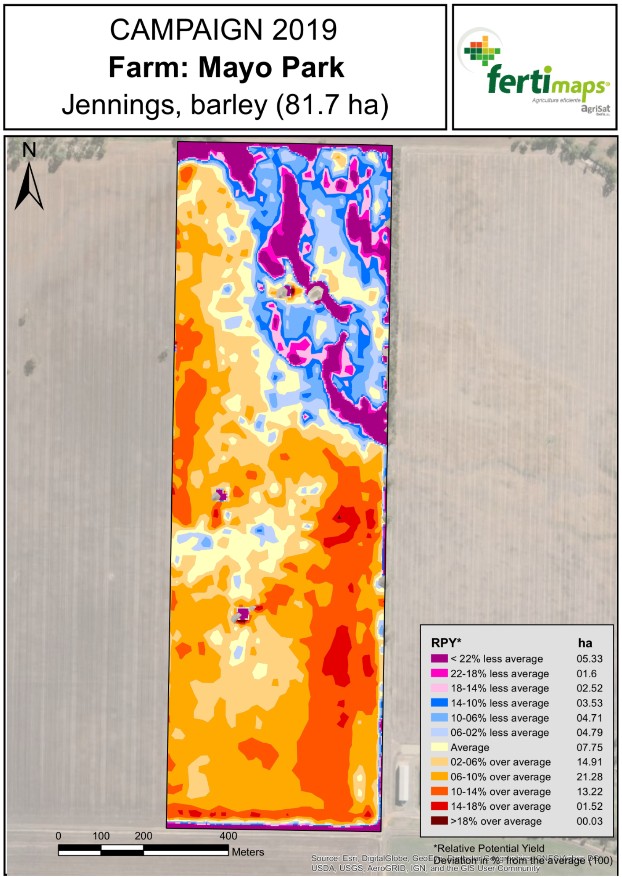
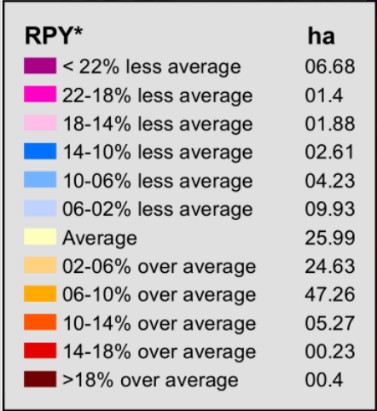
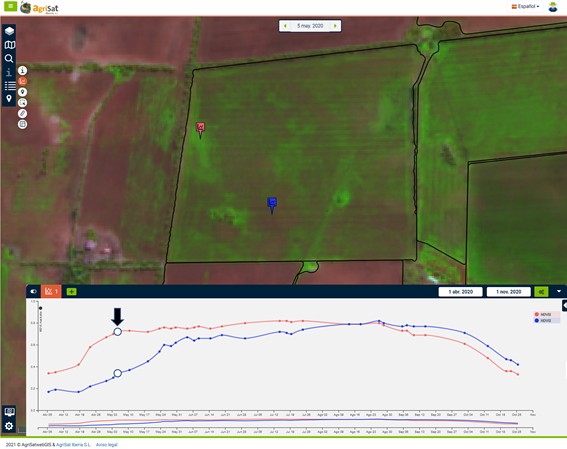
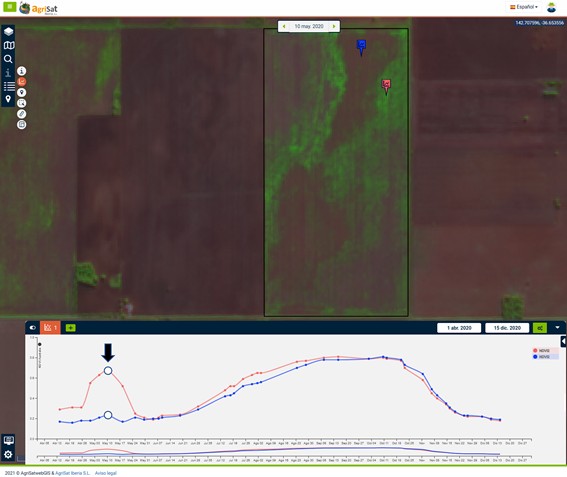
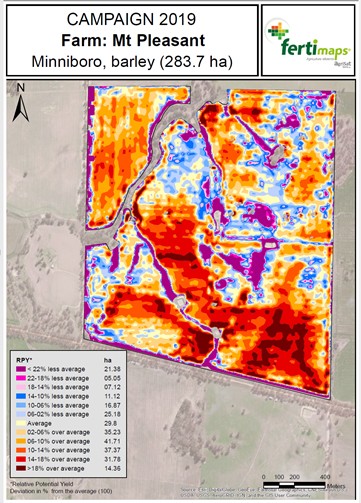
- The generation of management zone maps (MZM). These maps differentiate the different zones of the productive potential of the plot. They are generated by analysis of the NDVI time series of the crop in the previous season. The maps have a spatial resolution of 10×10 m pixel. You can see an example below.
- The Nitrogen Nutrition Index (NNI) for early detection of possible nitrogen deficiencies in crops and their correction.
- Crop yield estimation using the MYRS model. This model is based on the daily evolution of NDVI in the plot, meteorological data and crop water stress estimation. The MYRS model will be the topic of a forthcoming post.
Examples of the new COALA products
The use of time series of satellite images allows monitoring the crop week by week.
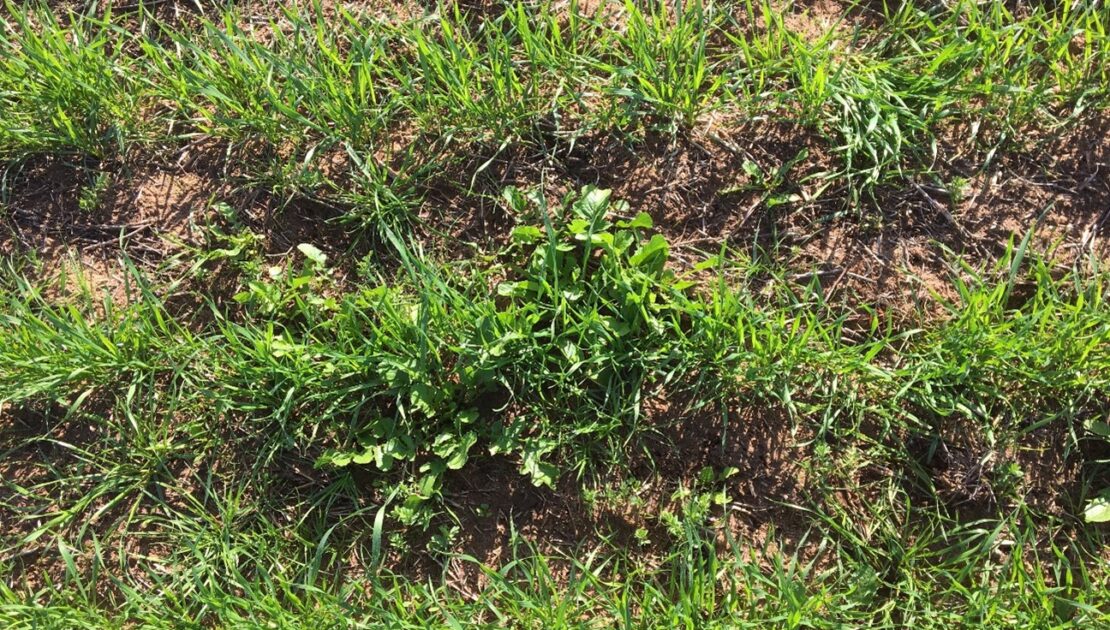
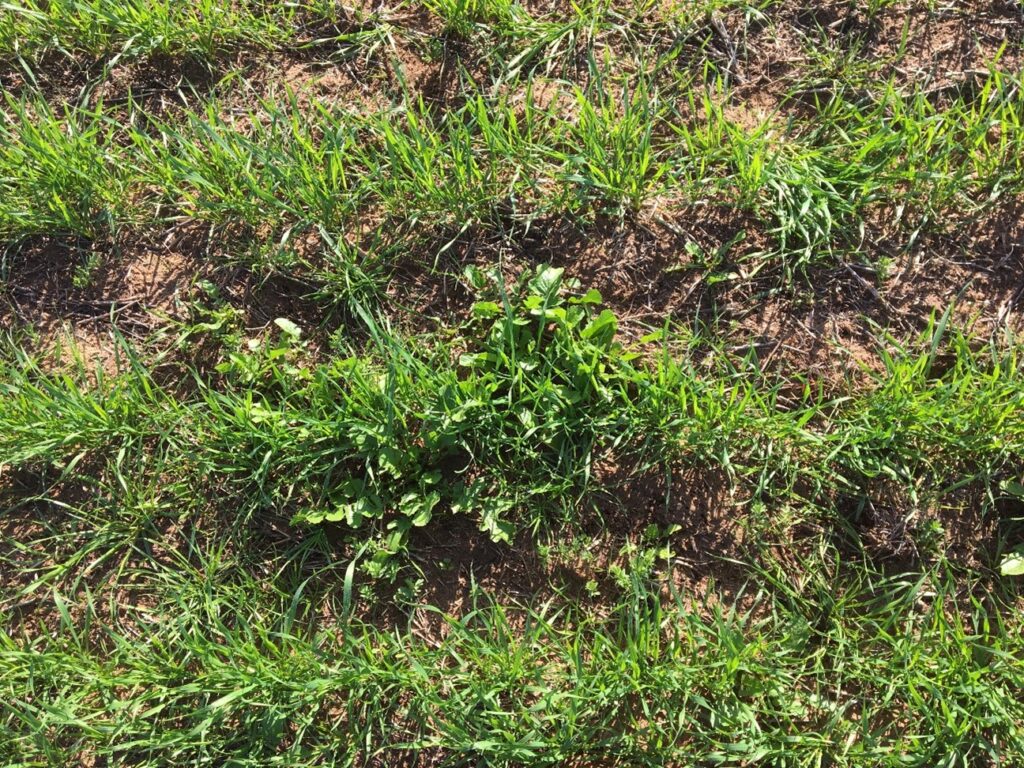
When we use satellite images we can detect weedy areas within the plot at the crop’s early stages (see image). Satellite images help us detect variations in crop development in the plot from one year to another so that we can adapt our management to these differences. For example, wheat evolution in 2019 and 2020 for the same plot in Cameron’s Ledkes paddock.
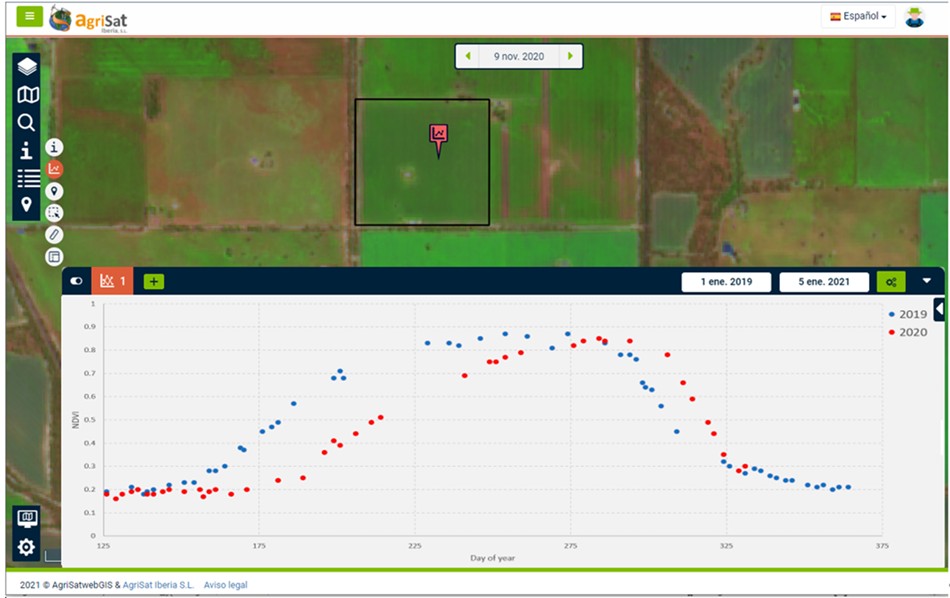
Example of wheat NDVI temporal evolution in two different growing seasons in Ledkes paddock (Cameron Taylor). The blue line shows the 2019 evolution of wheat. The Red line corresponds to 2020, with less crop growth at the beginning of the cycle. Early detection can be helpful for dryland crop management.
Canopy growth
Tim showed us a time loop video that he had made of the canola growing in one of his paddocks, which inspired us to complement it with the corresponding satellite images.
This video shows how the canola canopy evolves throughout the crop’s growth cycle. The canola canopy is growing in a field near Birchip, Victoria (Australia). The novelty combines photographs captured with a ground-based camera with the time series of Sentinel2 satellite images over the five-month growing period from May to November.
You can see the canopy growth both with the camera’s eyes at one point of the plot and with the view provided by the time series of Sentinel2 satellite images through the colour composition products and the NDVI value at one point. Next, notice the ground camera which shows mainly vertical growth. The time series of colour composition images describes the canopy’s variability and heterogeneity as seen from a zenith angle over the whole plot.
The time series of NDVI values quantify the relative photosynthetic size of the canopy at the point where it is measured. Look at the decrease in the NDVI curve when flowering occurs. Because the yellow flowers are not photosynthetically active and partially cover the canopy they cause a decrease in the NDVI. Now, you can notice the temporal pattern of NDVI, which is very characteristic of the evolution of canola. Canola, a variety derived from rapeseed, is a crop with significant development in Australia and elsewhere in the world.
The importance of Management Zone Maps
Management Zone Maps (MZM) allow you to detect the different productive zones of a plot year by year similar to yield monitors. The MZMs help avoid the numerous disadvantages of yield monitors. The disadvantages include frequent calibration of the equipment, the use of a single machine in the plot, the time dedicated to obtaining it, the possible breakdowns that may occur, etc.
The generation of the MZM from the time series of satellite data produces these maps quickly and accurately throughout the history of the plot. When we look at time series it’s possible to analyze the different areas of the plot from season to season. In this way, it is possible to detect if a management problem caused the differences in a specific year or if patterns are repeated year after year. Repeated patterns would lead us to consider that these differences are due to soil limitations. These maps are critical for different management tasks such as taking samples in the characteristic zones of the plot or for variable rate fertilization, harvesting (production and quality) or sowing.